
Google Analytics Audience Overview Report Explained

Data is the backbone of any digital marketing strategy.
In SEO and digital marketing, data-driven insights are the keystone of any successful strategy. Google Analytics is a powerful tool that provides these insights, but its complexity can be daunting for those who aren’t data experts. This article aims to simplify the Audience Overview report in Google Analytics, making it accessible for business professionals and corporate marketers.
What is the Audience Overview Report?
The Audience Overview report is a snapshot of essential metrics that website owners should pay attention to. It provides a summary of user interactions on your website, offering a quick way to gauge performance. This report is particularly useful for those who are new to Google Analytics or those who need a quick refresher.
Key Metrics in the Report
The Audience Overview report features eight primary metrics that are common across most Google Analytics reports:
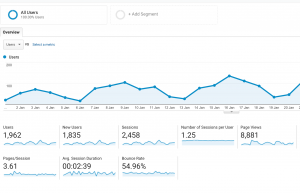
- Users: The total number of visitors to your site.
- New Users: First-time visitors during the selected period.
- Sessions: The total number of interactions a user has with your site.
- How a Session is Defined: Criteria determining what constitutes a session.
- Number of Sessions Per User: Average number of sessions per user.
- Page Views: Total number of pages viewed.
- Pages/Sessions: Average number of pages viewed per session.
- Average Session Duration: Average time spent on the site per session.
- Bounce Rate: Percentage of single-page visits.
Google Analytics offers various reports like Traffic Sources, Behaviour, and Conversions
Interpreting the Data
For instance, if the report shows 2,458 sessions in January 2019, with 1,962 individual users and 1,835 new users, you can start to get a sense of your website’s reach. The average session duration of 2 minutes and 39 seconds, along with 3.61 pages viewed per session, gives you an idea of user engagement.
Addressing Bounce Rate
A high bounce rate could be a red flag. It’s essential to identify the pages where users are exiting and take corrective action. For example, if the bounce rate is 54%, you might want to investigate the user experience on those specific pages and make improvements.
Next Steps
Understanding the Audience Overview report is just the beginning. Google Analytics offers a plethora of other reports like Traffic Sources, Behaviour, and Conversions that can provide deeper insights into your website’s performance.
Additional Resources
Data is the backbone of any digital marketing strategy, and Google Analytics is a robust tool that can provide you with the insights you need. The Audience Overview report is a good starting point for understanding your website’s performance and making data-driven decisions.
If you need help with any aspects of your online marketing strategy, please feel free to get in touch via our contact page.


Leave a Reply
Want to join the discussion?Feel free to contribute!